
Hello everyone,
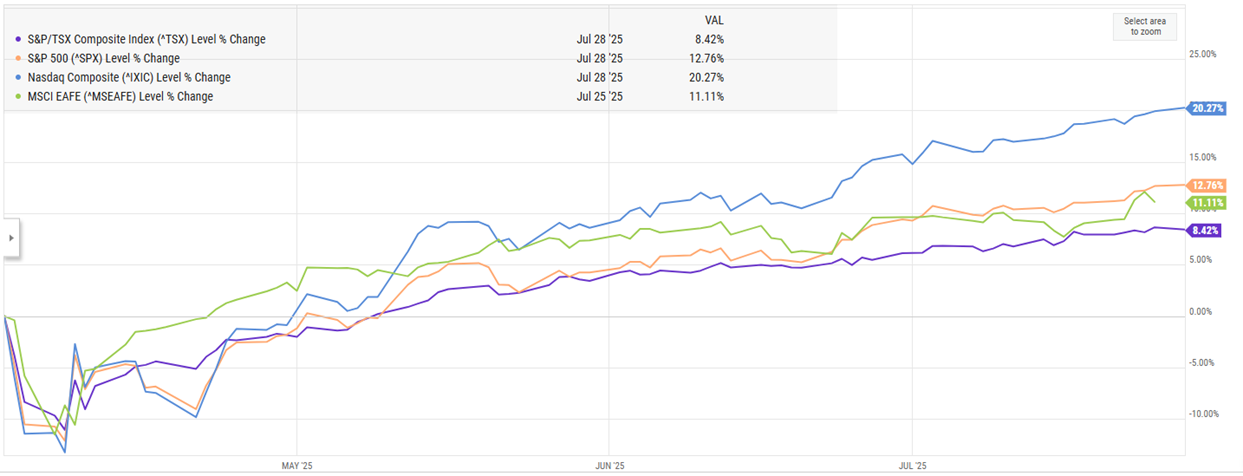
What can I say? We believe slow and steady wins the race. The S&P 500 is up 3.07% and the TSX also up 3.45% for the month of July. Seems to me that perhaps we've underestimated the world's resilience against, what I would have described, as a tough back drop. However, every month, financial markets around the world continue to climb. In fact, since April 2nd (President Trump's famed "Liberation Day"), investors have experienced nothing but growth. The illustration below, captures this uphill trend and it's impressive to say the least. The NASDAQ alone has surged 20.27% since that day.
The big question, why? While I can't give you definitive answers, I think it has been a combination of things. First, the U.S. administration has adopted flexibility in its deadlines as a negotiating strategy, extending tariff deadlines to facilitate agreements that are significantly more favorable than the initially imposed. For example, Japan faced a 25% tariff to take effect August 1st. Instead, a "Massive Deal" as President Trump put it, will now have goods taxed at 15%. However, Japan needs to start importing more U.S. goods and invest $550 billion in the U.S. economy to come clean in the agreement. (https://abcnews.go.com/Business/trumps-trade-agreement-japan/story?id=123991644). More recently, the U.S. also signed a deal with the E.U. to impose a 15% tariff.
Secondly, there is evidence suggesting that the U.S. economy remains in expansion as of July 27th, 2025. Economic forecasts indicate a continued growth trajectory with real GDP expected to grow by approximately 0.8% year-over-year by the end of 2025, reflecting ongoing economic expansion despite some slowdown compared to previous years. The recent passage of significant fiscal legislation, like the "One Big Beautiful Bill", has reduced policy uncertainty by extending critical tax provisions, which is expected to avoid a fiscal cliff and support economic stability (https://www.ey.com/en_us/insights/strategy/macroeconomics/us-economic-outlook). Additionally, steady job growth, as highlighted by upcoming jobs reports and steady non-farm payroll numbers, coupled with corporate earnings growth, further reinforce the view that the economy is not in recession but continuing to expand (https://www.cnn.com/2025/07/27/economy/economy-trump-trade-fed-earnings),(https://economictimes.indiatimes.com/news/international/us/us-economy-news-trump-economy-2025-fed-decision-jobs-report-us-economy-update-july-2025-inflation-trade-policy/articleshow/122953606.cms). Analysts also point to the moderation of inflation and a resilient consumer sector, despite ongoing challenges, as indicators consistent with an economy in expansion (https://economictimes.indiatimes.com/news/international/us/us-economy-news-trump-economy-2025-fed-decision-jobs-report-us-economy-update-july-2025-inflation-trade-policy/articleshow/122953606.cms),(https://www.fanniemae.com/data-and-insights/forecast/economic-developments-july-2025).
Thirdly, I think that the international security landscape and geopolitical risks have shown signs of abating as NATO members have reached a significant consensus to substantially increase their defense spending to 5% of GDP over the medium to long term. This collective commitment marks a decisive shift in the alliance’s strategic posture, aimed at strengthening deterrence and enhancing the capacity to respond to emerging threats. This enhancement in defense spending is expected to lead to significant modernization of military equipment, improvements in readiness and rapid deployment capacities, expanded cooperation in intelligence and cybersecurity efforts among members.
By committing to this higher level of investment, NATO seeks to project strength and solidarity, sending a clear message of unity and preparedness to potential adversaries; like Russia, North Korea and China. Moreover, the boost in defense expenditures contributes to lowering the geopolitical risk premium in global markets. When investors perceive heightened geopolitical tensions, financial volatility tends to rise, affecting international trade and investment decisions. NATO’s collective action to address defense preparedness mitigates these concerns by fostering a more secure environment, which in turn supports economic stability and growth.
Lastly, crude oil prices have declined more sharply than many analysts initially anticipated, driven primarily by steadily rising production levels in the United States coupled with the Organization of the Petroleum Exporting Countries' (OPEC) gradual rollback of voluntary supply cuts. These combined factors have significantly shifted the balance of supply and demand in the global oil market, contributing to a notable easing of energy costs worldwide.
The United States has seen a consistent increase in crude oil production, bolstered by technological advancements and investment in shale extraction. This has enabled producers to ramp up output efficiently. This sustained growth in U.S. oil supply has added substantial volumes to the global market, exerting downward pressure on prices. At the same time, the OPEC has begun systematically easing its earlier voluntary production constraints. Having initially imposed cuts to stabilize and support prices amid global uncertainties, the OPEC’s recent decisions to scale back these limits signal confidence in market conditions but also contribute to increased availability of crude.
The impact of these developments on oil prices has been significant. For example, West Texas Intermediate (WTI) crude closed June at $65.11 per barrel, reflecting a decline of approximately 24% compared to the corresponding period last year. This drop in energy prices presents broad implications for the global economy, especially in terms of inflation and consumer sentiment. Lower energy costs directly alleviate inflationary pressures, as fuel expenses are a key component in overall price levels. When crude prices fall, transportation and production costs tend to decrease, leading to more moderate increases in goods and services across the economy. This dynamic helps central banks in their efforts to contain inflation and stabilize purchasing power. Moreover, the decline in fuel prices has a direct and tangible benefit for consumers. Reduced costs at the gas pump and in home heating translate to less financial strain on household budgets. This can increase disposable income, encouraging greater consumer spending and boosting confidence in personal financial outlooks. As energy expenses become more manageable, consumers are better positioned to sustain consumption, which is critical for ongoing economic growth.
In summary, based on my thesis above, market participants had been predominantly focused on negative factors (and me) and failed to anticipate positive outcomes as the actual developments have consistently surpassed expectations. As a result, this divergence has driven the market upwards. While I'm ecstatic about this, August tends to snuff out candles. Historically, August ranks as one of the worst months for stocks, with the Dow Jones Industrial Average posting an average loss of about 1.1% during August over the past several decades. The Stock Trader's Almanac’s data highlights a recurring seasonal pattern often referred to as the "August Doldrums," where trading volumes decline and market volatility tends to increase, leading to generally subdued or negative returns (https://www.stocktradersalmanac.com/Newsletter/0824.aspx), (https://money.com/august-september-worst-month-stock-market/). Analysts attribute this weakness to various factors, including reduced investor activity during summer vacations and heightened uncertainty around economic and geopolitical events that often unfold during this period. As a result, many traders approach August with increased caution, sometimes adjusting their portfolios in anticipation of potential volatility but according to my thesis above, maybe, just maybe… we'll be okay next month!
The information contained herein has been provided by Rietze Duke & Associates Wealth Management and is for information purposes only. The information has been drawn from sources believed to be reliable. Graphs and charts are used for illustrative purposes only and do not reflect future values or future performance of any investment. The information does not provide financial, legal, tax or investment advice. Particular investment, tax, or trading strategies should be evaluated relative to each individual's objectives and risk tolerance.
Commissions, management fees and expenses all may be associated with investments in exchange-traded funds (ETFs). Please read the prospectus and ETF Facts before investing. ETFs are not guaranteed, their values change frequently and past performance may not be repeated. ETF units are bought and sold at market price on a stock exchange and brokerage commissions will reduce returns.
Certain statements in this document may contain forward-looking statements (“FLS”) that are predictive in nature and may include words such as “expects”, “anticipates”, “intends”, “believes”, “estimates” and similar forward-looking expressions or negative versions thereof. FLS are based on current expectations and projections about future general economic, political, and relevant market factors, such as interest and foreign exchange rates, equity and capital markets, the general business environment, assuming no changes to tax or other laws or government regulation or catastrophic events. Expectations and projections about future events are inherently subject to risks and uncertainties, which may be unforeseeable. Such expectations and projections may be incorrect in the future. FLS are not guarantees of future performance. Actual events could differ materially from those expressed or implied in any FLS. A number of important factors including those factors set out above can contribute to these digressions. You should avoid placing any reliance on FLS.
Source: London Stock Exchange Group plc and its group undertakings (collectively, the “LSE Group”). © LSE Group 2026. FTSE Russell is a trading name of certain of the LSE Group companies. “FTSE®”, “Russell®”, and “FTSE Russell®” are trademarks of the relevant LSE Group companies and are used by any other LSE Group company under license. “TMX®” is a trademark of TSX, Inc. and used by the LSE Group under license. All rights in the FTSE Russell indexes or data vest in the relevant LSE Group company which owns the index or the data. Neither LSE Group nor its licensors accept any liability for any errors or omissions in the indexes or data and no party may rely on any indexes or data contained in this communication. No further distribution of data from the LSE Group is permitted without the relevant LSE Group company’s express written consent. The LSE Group does not promote, sponsor or endorse the content of this communication. Index returns are shown for comparative purposes only.
Indexes are unmanaged and their returns include reinvestment of dividends, if applicable, but do not include any sales charges or fees as such costs would lower performance. It is not possible to invest directly in an index.
Links to other websites are for convenience only. No endorsement of any third-party products, services or information is expressed or implied by any information, material or content referred to or included on or linked from or to here.
TD Asset Management Inc. is a wholly-owned subsidiary of The Toronto-Dominion Bank.
Rietze Duke & Associates Wealth Management is part of TD Wealth Private Investment Advice, a division of TD Waterhouse Canada Inc. which is a subsidiary of The Toronto-Dominion Bank.
®The TD logo and other TD trademarks are the property of The Toronto-Dominion Bank or its subsidiaries.
