
What a month! The stock market in July showcased a mix of highs and lows, reflecting the dynamic nature of global financial markets. Investors experienced a rollercoaster ride as various factors, including great earnings reports, sector-specific trends, (tech mainly) and geopolitical events (who will ever forget!), influenced market movements throughout the month. But let's dive a little deeper into each of these.
The month began with a bang as the S&P 500 and Dow industrials reached new records, propelled by positive earnings reports and robust economic indicators. On July 3, the average daily S&P 500 gain stood at an impressive 0.49%, setting an optimistic tone for market performance (Markets Insider - Stock Market Outlook: July Has Best Days of Year for Equity Performance). And by July 16th, it reached a record breaking high, rising to 5669.67 for a 4.48% ((https://ycharts.com/indices/%5ESPX/level) month to date return. But wait, the euphoria was short lived.
Midway through the month, the technology sector faced a tumultuous period, sparking a series of downturns in the stock market. The Nasdaq experienced its most significant decline in nearly two years on July 17, triggering a broader market correction as investors rotated out of tech stocks. This downturn highlighted the sector's vulnerability and its impact on market sentiment (Barron's – Stock Market News From July 17th, 2024).
More specifically, the decline of semiconductor shares sent shockwaves throughout the stock market. The sector's stumble on July 17 contributed to substantial losses, marking one of the worst trading days in recent months. This slump raised concerns about supply chain disruptions and global economic stability, adding a layer of complexity to market dynamics (The New York Times – Stocks on Wall Street Drop).
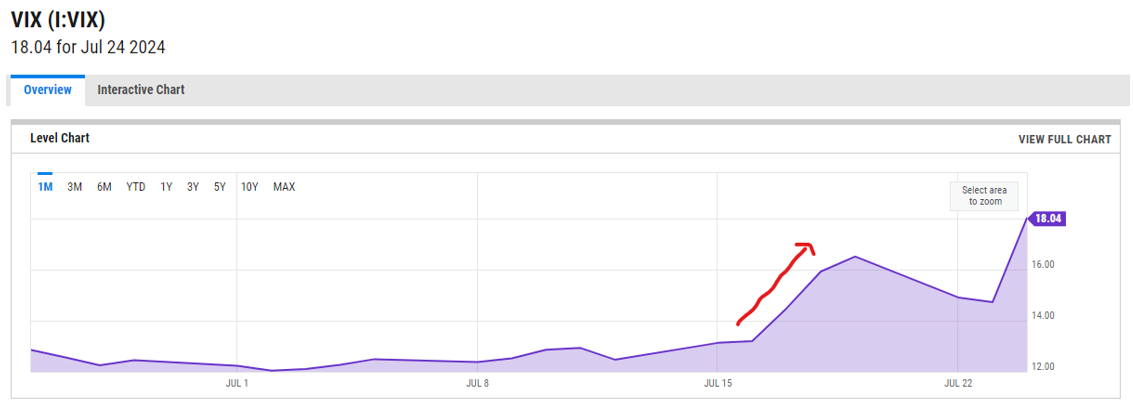
Then, the unthinkable: the attempted assassination of a former U.S. President. The implications of such a significant incident reverberate across various sectors, including financial markets. In the wake of the attempted assassination of former President Donald Trump, the S&P 500, a key indicator of the U.S. stock market, experienced immediate and notable reactions that reflected the market's sensitivity to geopolitical events. Market participants reacted to the unexpected and unprecedented nature of the event, rather favorably (weird) as party unification led to increased odds of tax cuts, higher tariff and looser regulation. Who would have thought? Lol. To no one's surprise, the VIX index, a measure of market volatility often referred to as the "fear gauge," experienced a notable uptick, 5.56% (https://ycharts.com/indicators/vix_volatility_index) reflecting the unease and apprehension among investors in the wake of the event.
Beyond the immediate market reactions, the longer-term implications of the assassination attempt on former President Trump remain a subject of ongoing scrutiny. The event has precipitated discussions about its potential impact on fiscal and monetary policies, international relations and broader geopolitical stability.
In keeping with the US political scene, the reaction of the S&P 500 to Joe Biden's decision not to rerun for the 2024 election was mixed. After the news broke, there were reports that in after-hours trading, futures for the S&P 500 index experienced a slight rise (The New York Times – Investors React to Election Upheaval, Raising Their Political Bets). However, it was noted that the S&P 500 recorded its worst three-day performance of 2024 following the announcement, indicating a level of uncertainty and market volatility (CNN – Global markets close higher amid upheaval in US Presidential Race). Despite this, other factors such as global market conditions also played a part in influencing the performance of the S&P 500 during that period.
Closer to home, the performance of the Toronto Stock Exchange (TSX) for the month of July 2024 was marked by fluctuations and mixed results, up 3.49% as of June 25th (https://ycharts.com/indices/%5ETSX/level) . While certain sectors showed resilience, such as technology and healthcare, others faced challenges, particularly in energy and financials. External factors, including global market trends and geopolitical tensions, also contributed to the TSX's performance during this period (The Globe and Mail - Index Price History for TSX Composite Index TXCX - The Globe and Mail).
The TSX's July 2024 performance was influenced by a combination of macroeconomic indicators, corporate earnings releases and international developments, particularly the US political landscape. Participants closely monitored economic data such as GDP growth, employment figures, and inflation rates to assess the health of the Canadian economy and its implications for stock performance (The Globe and Mail - TSX Composite Index (TXCX) Quote - The Globe and Mail). Last Wednesday, the Bank of Canada slashed another 25 basis points bringing the overnight lending rate to 4.50%. They also indicated that perhaps more reductions could come if inflation continued to abate. The Bank of Canada also lowered its economic forecast from 1.50% to 1.20% because households are paying down debt, which in turn means less money to go around on discretionary items. Not a bad thing, I think?
July 2024 was marked by a series of significant market events that underscore the inherent volatility and resilience of the stock market. As we navigate through the ebbs and flows of market performance, adaptability and informed decision-making will remain key drivers of success in an ever-evolving financial landscape.
So, there you have it, a summary of July. I know a lot of you are visiting and taking some much-needed time away but please be safe, responsible and most of all have fun and enjoy the sun! See you all soon.
The information contained herein has been provided by Rietze Duke & Associates Wealth Management and is for information purposes only. The information has been drawn from sources believed to be reliable. Graphs and charts are used for illustrative purposes only and do not reflect future values or future performance of any investment. The information does not provide financial, legal, tax or investment advice. Particular investment, tax, or trading strategies should be evaluated relative to each individual's objectives and risk tolerance.
Commissions, management fees and expenses all may be associated with investments in exchange-traded funds (ETFs). Please read the prospectus and ETF Facts before investing. ETFs are not guaranteed, their values change frequently and past performance may not be repeated. ETF units are bought and sold at market price on a stock exchange and brokerage commissions will reduce returns.
Certain statements in this document may contain forward-looking statements (“FLS”) that are predictive in nature and may include words such as “expects”, “anticipates”, “intends”, “believes”, “estimates” and similar forward-looking expressions or negative versions thereof. FLS are based on current expectations and projections about future general economic, political, and relevant market factors, such as interest and foreign exchange rates, equity and capital markets, the general business environment, assuming no changes to tax or other laws or government regulation or catastrophic events. Expectations and projections about future events are inherently subject to risks and uncertainties, which may be unforeseeable. Such expectations and projections may be incorrect in the future. FLS are not guarantees of future performance. Actual events could differ materially from those expressed or implied in any FLS. A number of important factors including those factors set out above can contribute to these digressions. You should avoid placing any reliance on FLS.
Source: London Stock Exchange Group plc and its group undertakings (collectively, the “LSE Group”). © LSE Group 2026. FTSE Russell is a trading name of certain of the LSE Group companies. “FTSE®”, “Russell®”, and “FTSE Russell®” are trademarks of the relevant LSE Group companies and are used by any other LSE Group company under license. “TMX®” is a trademark of TSX, Inc. and used by the LSE Group under license. All rights in the FTSE Russell indexes or data vest in the relevant LSE Group company which owns the index or the data. Neither LSE Group nor its licensors accept any liability for any errors or omissions in the indexes or data and no party may rely on any indexes or data contained in this communication. No further distribution of data from the LSE Group is permitted without the relevant LSE Group company’s express written consent. The LSE Group does not promote, sponsor or endorse the content of this communication. Index returns are shown for comparative purposes only.
Indexes are unmanaged and their returns include reinvestment of dividends, if applicable, but do not include any sales charges or fees as such costs would lower performance. It is not possible to invest directly in an index.
Links to other websites are for convenience only. No endorsement of any third-party products, services or information is expressed or implied by any information, material or content referred to or included on or linked from or to here.
TD Asset Management Inc. is a wholly-owned subsidiary of The Toronto-Dominion Bank.
Rietze Duke & Associates Wealth Management is part of TD Wealth Private Investment Advice, a division of TD Waterhouse Canada Inc. which is a subsidiary of The Toronto-Dominion Bank.
®The TD logo and other TD trademarks are the property of The Toronto-Dominion Bank or its subsidiaries.
